Página principal
7tmo bàsica Computaciòn
Home
Páginas
Página principal
Home
miércoles, 20 de noviembre de 2019
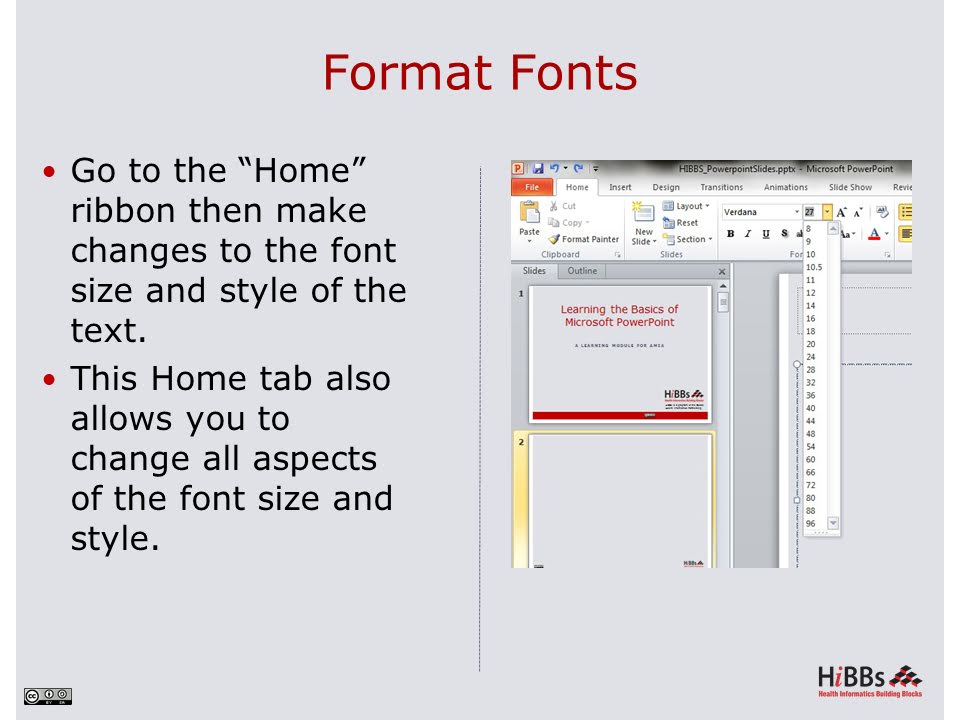
PowerPoint for Windows
5:37
No comments
PowerPoint for Windows
Click Aqui
jueves, 14 de noviembre de 2019
Create a chart in Excel (crear un gráfico en Excel)
5:27
No comments
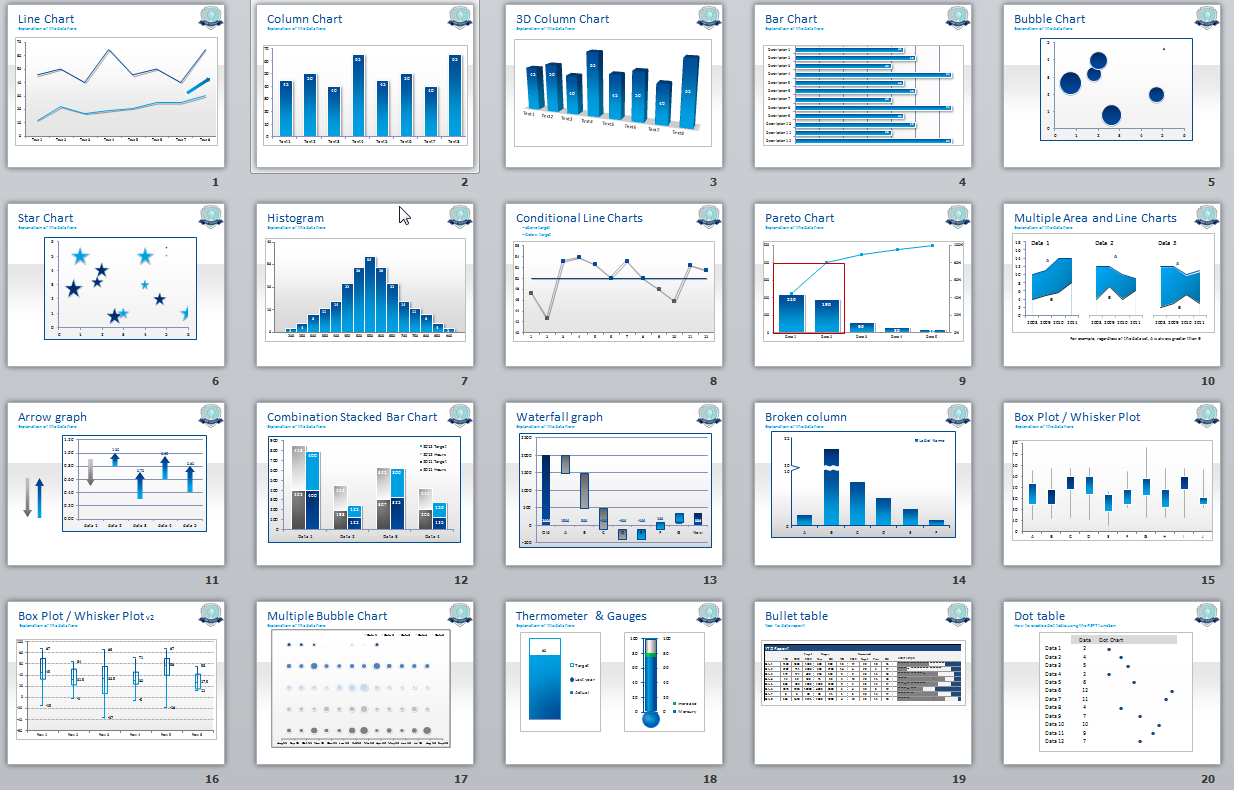
Create a chart in Excel
(crear un gráfico en Excel)
Create a chart
Select the data for which you want to create a chart.
Click
INSERT
>
Recommended Charts
.
On the
Recommended Charts
tab, scroll through the list of charts that Excel recommends for your data, and click any chart to see how your data will look.
Click Aqui
Entradas más recientes
Entradas antiguas
Inicio
Suscribirse a:
Entradas (Atom)
Social Profiles
Blog Archive
►
2020
(4)
►
junio
(2)
►
enero
(2)
▼
2019
(16)
▼
noviembre
(2)
PowerPoint for Windows
Create a chart in Excel (crear un gráfico en Excel)
►
octubre
(1)
►
septiembre
(1)
►
agosto
(2)
►
julio
(4)
►
junio
(2)
►
mayo
(4)
Con la tecnología de
Blogger
.